Serhii Borovykov · Product designer and AI builder

Drawing the map · sharpening

My life's headquarters

Headquarters crew

Rally HQ · Staff

Me looking down, checking a clock.
timekeeper

Prologue

Rally HQ · Staff

Me mid-sentence, a pitch deck under one arm.
founder

Rally 1

Rally HQ · Staff

Me with a marker, half-turned to a whiteboard.
design leader

Rally 2

Rally HQ · Staff

Me holding up a sheet with boxes and arrows.
systems thinker

Rally 3

Rally HQ · Staff

Me at a laptop, looking up over the glasses.
builder

Rally 3

Rally HQ · Staff

Me grinning, a squash racket over the shoulder and goggles pushed up on the beanie.
athlete

Service park

Rally HQ · Staff

Me with eyes half closed, a book in one hand and a mug in the other.
philosopher

Service park

Rally HQ · Staff

Me looking down kindly at a trailing plant, a watering can in hand.
gardener

Service park

Rally HQ · Staff

Serhii Borovykov
S. BorovykovChairman

All access

New York time

Life stages

Roadbookall stages

– rallies service park back to HQ H what opensTap a place to zoom in zoom out – another place H what opensTap the map to zoom out

RallySpecial stageOn stage nowRoad section
My rallies

Roadbook

CrewSerhii Borovykov
3

StarbridgeHead of design · 2025–now · New York

$1M $20MStarbridge’s ARR while I’ve led design

Open
  1. Leg 3 · Marketing
  2. 3.7Asset libraryOn stage now

    1,136Assets in the library, as of November 1, 2026

    9Team members making materials with it

    1 systemFor the website, slides and social posts

    Open
  3. 3.6Product graphicsOn stage now

    54Product graphics in four weeks

    Still or animatedA still of one screen, or a walkthrough of a whole flow

    HTMLFlows from Storybook tests, sharp at any size

    Open
  4. 3.5Marketing websiteOn stage now

    ~210 pagesRebuilt in five days

    6Marketers onboarded

    Weeks dozens a dayHow fast website changes ship

    Open
  5. Leg 2 · Customer intelligence
  6. 3.3Customer intelligence pipelinesOn stage now

    20,527Signals kept, from 776 customer accounts

    1 in 4Candidates the quality check agent throws out

    3 lanesExisting customers, onboarding and sales trials

    Open
  7. Leg 1 · Design
  8. 3.2Prototype environmentOn stage now

    3–5xFaster design on the first feature. 9–10 weeks of work done in 3.

    5–10xMore complete specs in Linear, written from the prototype

    8 monthsDesigning without Figma, and counting

    Open
  9. 3.1Core product redesign

    ~1 monthCoding the new feed, live in January 2026

    2Designers hired once the feed shipped

    2% 50%Users who set up their own searches, once Bridge creation was redesigned

    Open
2

SmartcatDirector of product and head of design · 2021–2025 · Boston

$0.5M $15MSmartcat’s ARR while I led product and design

Open
  1. 2.3Agentic transformation

    89%Of client companies adopted the agents, 1,200 in all, half of the Fortune 500 among them

    Open
  2. 2.2Team, principles and philosophyOpen
  3. 2.1Design system and product-led growth

    7% 85%Activation

    55% 98%Task completion

    0% 5%Conversion of the new self-subscription

    Open
1

UboroFounder · 2014–2021 · Kyiv

0 1Founder’s mindset, used in every job since

Open
  1. 1.1Rally to fleet tracking

    70,000Objects tracked at its peak

    4,000Cairo cab drivers studied with Uber, on Uboro’s app

    5People on the team

    Open
0

How it startedTiming and safety tracking · 2006–2014 · Kyiv

3Skills I came away with: a builder’s mindset, thinking from first principles, and carrying pressure through chaos

Open
  1. 0.1Where I became a builder

    112Rallies timed

    35Clocks across the Yalta Rally, 2012

    Open
About · Headquarters crew

Organizer's welcome

A word from the chairman

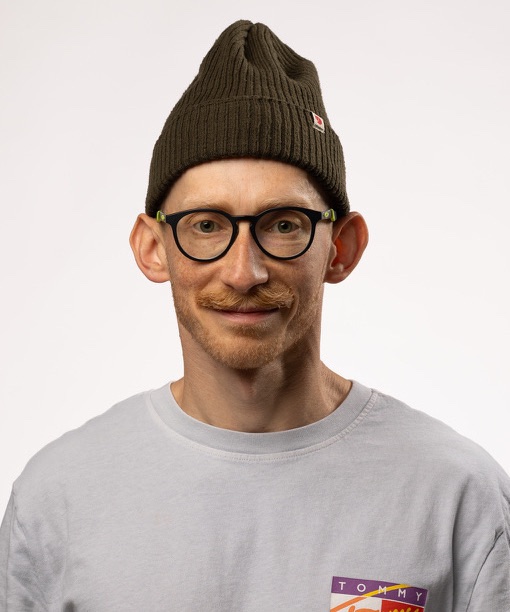
A photo of me in a dark beanie, round glasses and a grey T-shirt, smiling a little.

I’m a builder. I became one at rallies: for eight years I built the clocks, the timing and the GPS tracking they needed. Every rally ran on those systems, where one mistake could break everything and stop the race. Those years taught me to stay calm under immense pressure and still make clear decisions.

Since then I’ve been a founder, a product designer, a product executive, and now a head of design who builds again, with AI. Each role showed me problems from another side and gave me a taste for how things should feel when they’re right. I also go deep into psychology: what I learn about how people behave and decide shapes every experience I build.

I get the most joy from making things other people consider impossible, and from clearing bottlenecks. Good design makes me feel better, and it makes the world better, through better experiences.

Serhii Borovykov

Things I do

I’m head of design at Starbridge, an AI platform that helps companies win government and education contracts. I redesigned the core of the product and created its first design system, and with Claude Code I build the tools our teams work with: a prototype environment the designers left Figma for, customer intelligence pipelines that read every call and email overnight, and an in-house content factory for marketing, with a website they run from Slack.

On Substack I write about this work: how I moved design into code, starting with Three weeks instead of three months, and what changed for marketing in What a product launch looks like in an AI-pilled marketing org.

Things I did

From 2021 to 2025, I was head of design at Smartcat, an AI translation platform in Boston, and later also director of product: I led 30 engineers and designers in five teams and owned the product for its marketplace of 500,000 freelance linguists. I designed its product-led growth funnel and, in 2024, when AI threatened translation, redesigned the platform around AI agents.

From 2014 to 2021, I ran my startup Uboro, taking the GPS tracking I’d built for rallies to companies and their fleets. I designed every product and wrote the web front end. In 2018 Uboro’s app carried a study of 4,000 cab drivers in Cairo, run with the University of Illinois and Uber.

From 2006 to 2014, I timed car rallies, among them rounds of the Intercontinental Rally Challenge and the FIA European Rally Cup. It started with a timing clock I built in my last year of university.

Academically, I graduated in 2007 with a master’s in computer science from Dnipro National University of Railway Transport, where my research was in computer networks.

I commit to flowing with inspiration, solving problems with empathy, and strengthening both mind and will while remaining open to life’s serendipitous moments.

Rally HQ

The crew

  1. Me looking down, checking a clock.
    The timekeeper

    Built the GPS clocks that stood at every start and finish, and the timing that printed the results. 112 rallies.

  2. Me mid-sentence, a pitch deck under one arm.
    The founder

    Started Uboro with a pitch deck and a hundred LinkedIn messages a day, and learned to show something, not promise it.

  3. Me with a marker, half-turned to a whiteboard.
    The design leader

    Built design teams at Smartcat and Starbridge: find the right people, give them meaningful challenges and let them cook.

  4. Me holding up a sheet with boxes and arrows.
    The systems thinker

    Names things before anyone draws a screen: an object model, then the flows. Asks “do you mean how it looks, or how it works?”

  5. Me at a laptop, looking up over the glasses.
    The builder

    Built the prototype environment, the customer intelligence pipelines, the website and the rest of the software factory, with Claude Code.

  6. Me grinning, a squash racket over the shoulder and goggles pushed up on the beanie.
    The athlete

    Swam at world and European championships, played squash at the Pan American Masters Games, and plays golf with a handicap of 15.

  7. Me with eyes half closed, a book in one hand and a mug in the other.
    The philosopher

    Lives by kalokagathia: the body of an athlete, the mind of a scientist and the soul of a philosopher. Thinks about new forms of society.

  8. Me looking down kindly at a trailing plant, a watering can in hand.
    The gardener

    Grows plants at home, a lot of them and of many kinds.

CV
DownloadPDF
A photo of me in a dark beanie, round glasses and a grey T-shirt, smiling a little.

Product designer and AI builder · New York

Serhii Borovykov

Over the past twelve years I’ve founded a GPS tracking startup and led design, then product, at Smartcat, where I redesigned the platform around AI agents. Now I head design at Starbridge, where I design in code and build the tools: a prototype environment that replaced Figma for the design team, customer intelligence pipelines that read every call and email overnight, and an in-house content factory for marketing. Before my product career, eight years of timing car rallies taught me to stay calm under intense pressure and gave me my love of making things other people consider impossible.

$1M to $20M Starbridge’s ARR while I’ve led design

$0.5M to $15M Smartcat’s ARR while I led product and design

4x faster A full design cycle

Experience

Head of Design | AI Builder · Starbridge · New York · Oct 2025 – Present

An AI platform that helps companies win government and education contracts.

  • Starbridge’s ARR has grown from $1M to $20M while I’ve led design.
  • Within three months, redesigned and shipped the core of the product and created Starbridge’s first design system. Then simplified search setup, and the share of users who set up their own searches rose from 2% to 50%. Core product redesign and Starbridge’s first design system
  • Moved design into code by building a prototype environment with Claude Code. Design specs are written automatically from the prototype and drive automated UI tests, so the UI ships pixel-perfect with zero handoff errors, which was impossible before, and designing a feature is 4x faster. Prototype environment
  • Moved the 210-page marketing website off Webflow and rebuilt it with Claude Code in five days. In its first six weeks, marketing shipped 86 releases straight from Slack, with no tickets. Marketing website, run from Slack
  • Built customer intelligence pipelines that read every call and email overnight, delivering 20,000+ signals across 776 accounts and surfacing 1,300+ actionable problems for the roadmap. Customer intelligence pipelines
  • Built an in-house content factory for marketing, on a unified design system for every surface (website, slides, social posts), with an asset library of 1,136 assets and product graphics and animations generated from the product. Asset library and the marketing design system

Director of Product and Head of Design · Smartcat · Boston · Apr 2021 – Oct 2025

An AI translation platform for enterprises.

  • Smartcat’s ARR grew from $0.5M to $15M while I led product and design.
  • Designed and implemented a product-led growth funnel: activation rose from 7% to 85%, task completion from 55% to 98%, and self-subscription from 0% to 5%. Unified eleven separate use cases into one product. Eleven separate use cases became one product
  • In response to the rise of AI translation, redesigned the platform around AI agents and architected the file-based system they run on, adopted by 89% of clients (1,200 companies, including half of the Fortune 500). AI agents do the work, people check it
  • Owned the marketplace product connecting customers and translation agencies with 500,000 freelance linguists: job matching, ratings, invoicing and payouts worldwide.
  • As director of product, led 30 engineers and designers in five product teams. Built and ran a design team of seven, hiring and mentoring designers to help them grow, and empowering them to own their work with full accountability. Team, principles and philosophy

Founder · Uboro · Kyiv · 2014 – 2021

GPS fleet tracking.

  • Took rally tracking technology to the commercial fleet market, raised a $200k angel round, and scaled to 70,000 tracked objects. Rally to fleet tracking
  • Designed every product and built the web front end (HTML/CSS).
  • Uboro’s app carried a study of driver behavior among 4,000 cab drivers in Cairo, run with the University of Illinois and Uber.

Writing

Skills

Product Design & Product Management
Complex B2B SaaS, marketplace platforms, AI-driven products, and 0-to-1 products
Design Systems & Prototyping
Building in code, rapid prototyping, workflow automation, and zero handoff processes
AI Workflows
AI-powered workflows for design, product, and marketing teams; AI agent workflows; leveraging Claude Code, Claude skills, MCP servers, and automation tools
Growth & Delivery
Product-led growth (PLG) and product-led sales (PLS), funnel optimization, scaling teams, driving ARR, resolving bottlenecks, and launching new business lines
Leadership
Team hiring and mentorship, cross-functional leadership, stakeholder alignment, building processes that empower teams, remote team management, and change management
User Research & Data
Data-driven decision-making, user research, and translating insights into product improvements
Technical Tools
Figma, HTML/CSS/JS, Claude Code, Storybook, GitHub, n8n, Linear, Notion, Slack, Mixpanel, FullStory

Education and languages

Education
Master’s in Computer Science (research in computer networks) · Dnipro National University of Railway Transport, Dnipro, Ukraine · 2004 – 2007
Languages
English, Ukrainian, Russian
Beyond work
Swimming (world and European championships), squash (Pan American Masters Games), golf (handicap 15), pickleball (World Tour Series winner), gardening, and competitive Polytopia.
Stage report
0.1Special
stage

Prologue · Kyiv · 2006–2014

Where I became a builder

In my last year of university I built a rally timing clock. Then I built the equipment that timed every car and the GPS tracking that made rallies safer.

112Rallies timed

35Clocks across the Yalta Rally, 2012

The bottleneck

I saw a problem in Ukrainian rallying: there was no reliable way to keep every clock across a rally in sync. In rallying, time is everything, so every clock has to agree to the second.

Each clock was synced by hand: a special crew drove around the rally, switched the clocks on and connected a computer to each one to set its time. If a clock switched off during the rally, there was no quick way to switch it back on with the right time. So clocks often fell out of step, and that caused a lot of problems with the results.

The clock

My idea was to take the time from GPS satellites. That way, it no longer mattered if a clock switched off: as soon as it was back on, it took the exact time from the satellites, the same time every other clock showed, wherever it stood.

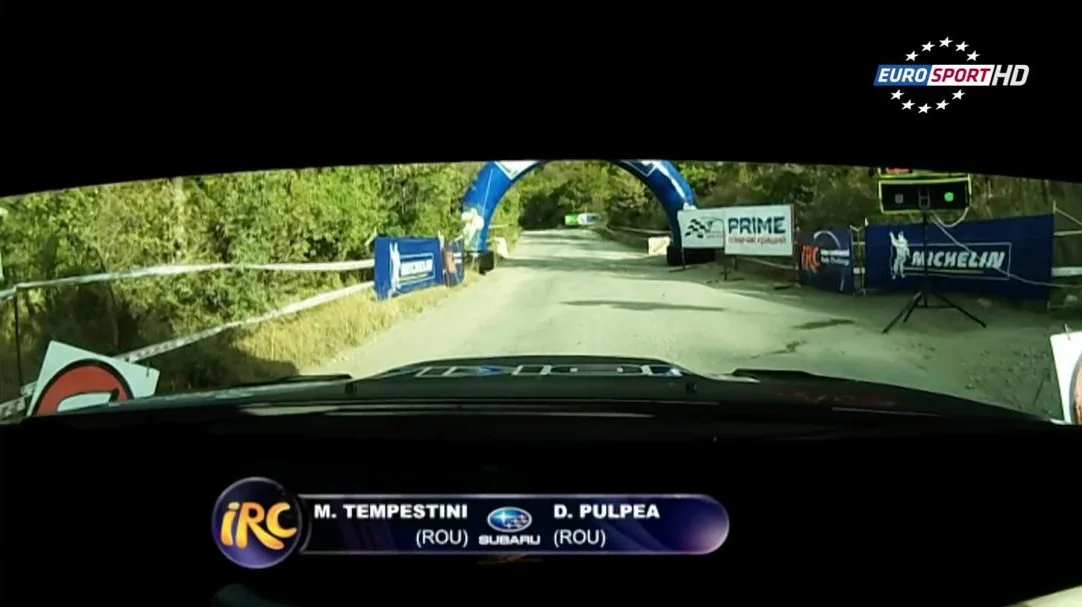
It was a long black box on a tripod, with big red seven-segment digits and fluorescent lime-yellow caps at each end. The caps shaded the digits from the sun, and closed over the display like lids when the clocks traveled. I built them and wrote their software. They stood at the start and finish lines and at every time control, where crews get their time cards stamped.

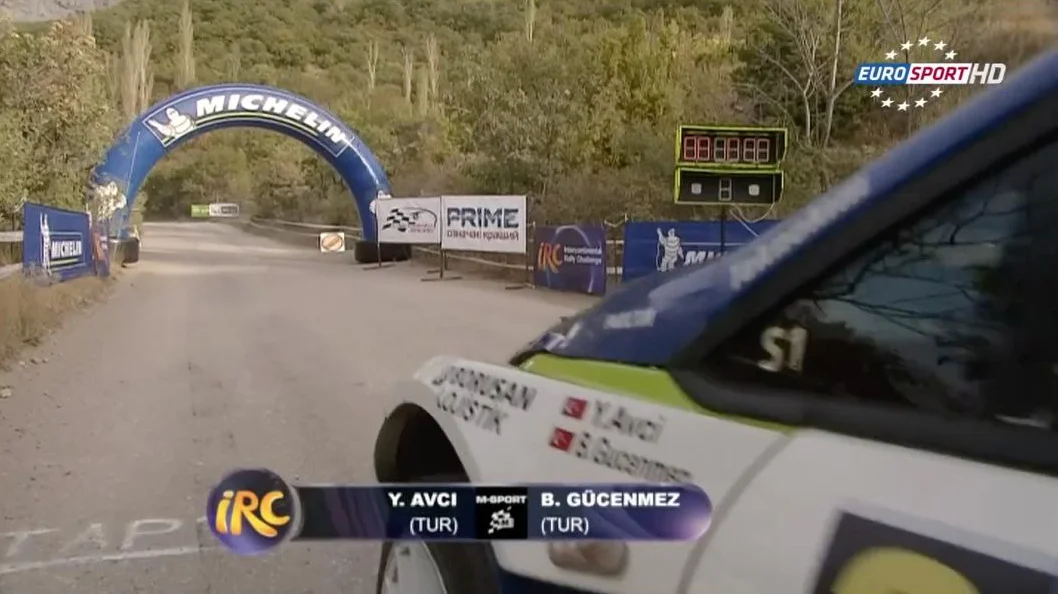
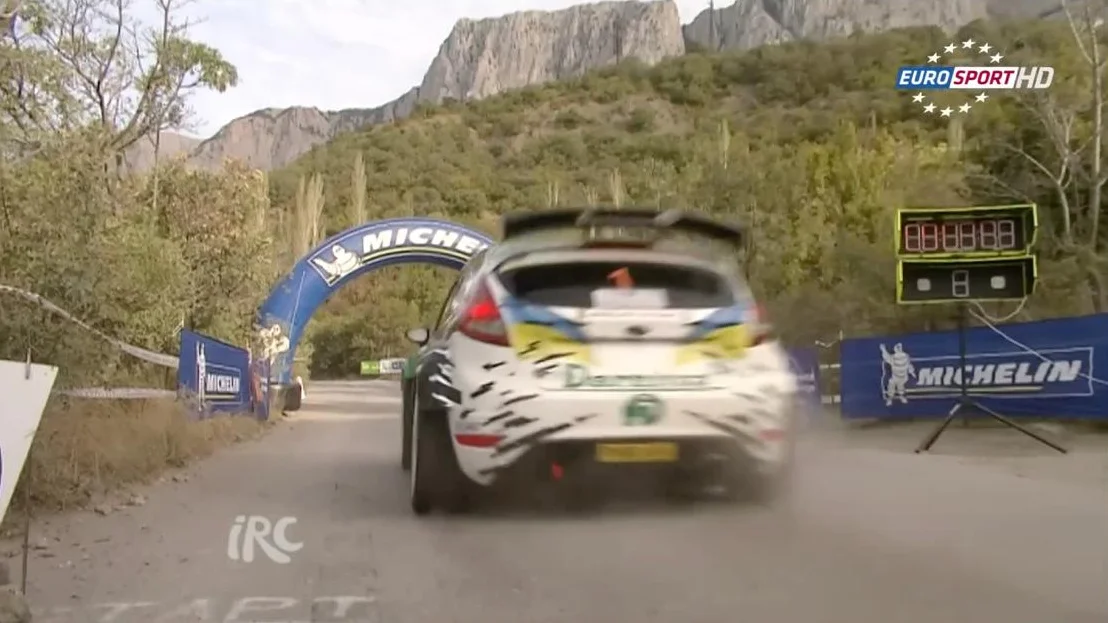
Stills from Eurosport’s coverage of the Yalta Rally. The box under the time counts down the five seconds before the start, with yellow and green lights.

That clock led me into timing rally competitions. There I built new timing equipment to replace the old: it recorded each car’s start and finish and printed the times on the spot. That printout was the official proof of who won.

Then I took on another problem: safety. A rally spreads across a whole region, so after a crash it was hard to find out where it happened. I designed and built GPS trackers for the cars, and software that showed every car on a map at headquarters. From then on, if a car crashed, we could see where right away, and that made the rally much safer.

Years later, that tracking software became my startup, Uboro.

Where I learned to carry pressure

A rally is a small society for a weekend. It takes a lot of money and hundreds of people, and the government too, because we close public roads. It takes months of planning. Then it goes live, and it can’t stop until it ends. Cars race through the stages, marshals stamp time cards, headquarters tracks every car, and the service park fixes them. On race day, the whole rally ran on the clocks, the timing and the tracking I built. One mistake can break all of it, and everyone feels that, at every level.

The day the clocks stopped. The peak was the Yalta Rally in 2012, a round of the Intercontinental Rally Challenge, shown on Eurosport. Two days, factory teams, about a thousand people organizing it, a budget of around ten million dollars, and observers from the FIA, the sport’s world governing body, there to keep it at the series’ level. At noon on the first day, all 35 clocks across the rally froze at 00:59:59. They had lost the satellites, and I couldn’t find out why. For the next hour I felt every bit of the pressure, and the guilt: the clocks were mine, and ten more minutes of it would have canceled the rally. At one o’clock they came back on their own.

That night I searched for the cause and couldn’t find it. We knew it would happen again at noon, so for the second day we issued a bulletin, the official notice to every crew: a pause from noon to one. At noon the clocks froze again, right on time, and the rally waited. Back home, with fresh eyes, I opened one clock and found the bug at once: one comma in the wrong place. The clocks ran on a microchip I programmed in assembly language, where you write every instruction for the chip by hand, down to single bits, so one misplaced comma was enough to stop everything.

I lived through many days like that, ten to twenty-five rallies a year, and year after year, pressure stopped overwhelming me.

What came with me into product

Plan the route to the minute. A rally timetable is set months ahead, to the minute. I still plan that way, and it’s how I navigate complex projects.

Give everyone the same clock. Every marshal and every crew worked from the same time, the same truth. I do the same with context: when the product team and every stakeholder see the same thing, they stay aligned and get there faster. So I build one living version of the product that designers, engineers and product managers all work from. At Starbridge, that’s the prototype environment. I wrote about getting people to mean the same thing by the same words in my article Everyone agrees, nobody’s aligned.

Build the instruments headquarters needs. At every rally I looked for the next bottleneck and built the tool that cleared it: the clocks, then the timing, then the trackers. I do the same today, and I’ve built a lot of internal tools for marketing and design teams. Two of them are the customer intelligence pipelines and the marketing website, run from Slack.

Stage report
1.1Special
stage

Uboro · Kyiv · 2014–2021

Rally to fleet tracking

I founded Uboro: GPS tracking for companies and their fleets.

70,000Objects tracked at its peak

4,000Cairo cab drivers studied with Uber, on Uboro’s app

5People on the team

The bottleneck

After the Yalta Rally in 2012 and the Aleksandrov Rally in 2013, colleagues from across Europe noticed my rally tracking and wanted to use it at the European Rally Championship. The final tests were planned for 2014. That year Russia occupied Crimea and invaded Ukraine’s eastern regions. Racing in Ukraine stopped, and the tracking had no rallies left.

The call: take it to fleets

Fleet tracking already existed, but it came with forced contracts, slow software and overpriced plans, and it looked faceless and boring. I saw an opening.

We left behind everything that only a rally needed, kept what a fleet could use, and built on top of it.

Uboro tracked vehicles, field staff and equipment through whatever sensors they carried, down to the condition each machine was in. You paid by the day, only for what was being tracked. Companies tracked their fleets with it, and people used it to check where their own car was.

From Uboro’s pitch deck: the tracking platform at the center, the apps built on it, and the ones we planned to scale into.

We made Uboro look nothing like the rest: fresh colors, a non-corporate tone and cartoon characters, like the one in our launch video.

Uboro’s launch video: the trucks on a city’s roads become pins on a map.

Show something, don't promise it

When I started Uboro, I didn’t know what a startup was, how one worked or how to put a team together. All I had was a pitch deck, and I took it to road shows.

On my way home from one road show, I ran into one of its judges at the railway station. She lived in my city too, and I told her how hard it was to convince people of something I couldn’t show them. She asked why I didn’t gather a team, give them a part of the company and build something, so that at the next pitch I’d show something instead of promising it. I didn’t believe that was possible.

Back home I started writing to engineers on LinkedIn, about a hundred messages a day. Ninety-nine out of a hundred told me I was stupid to offer work without pay. But after a while, curious people started asking questions. Within several months I had two co-founders and a team, and we built a pilot. From then on, the pitches went much better.

Our first $100

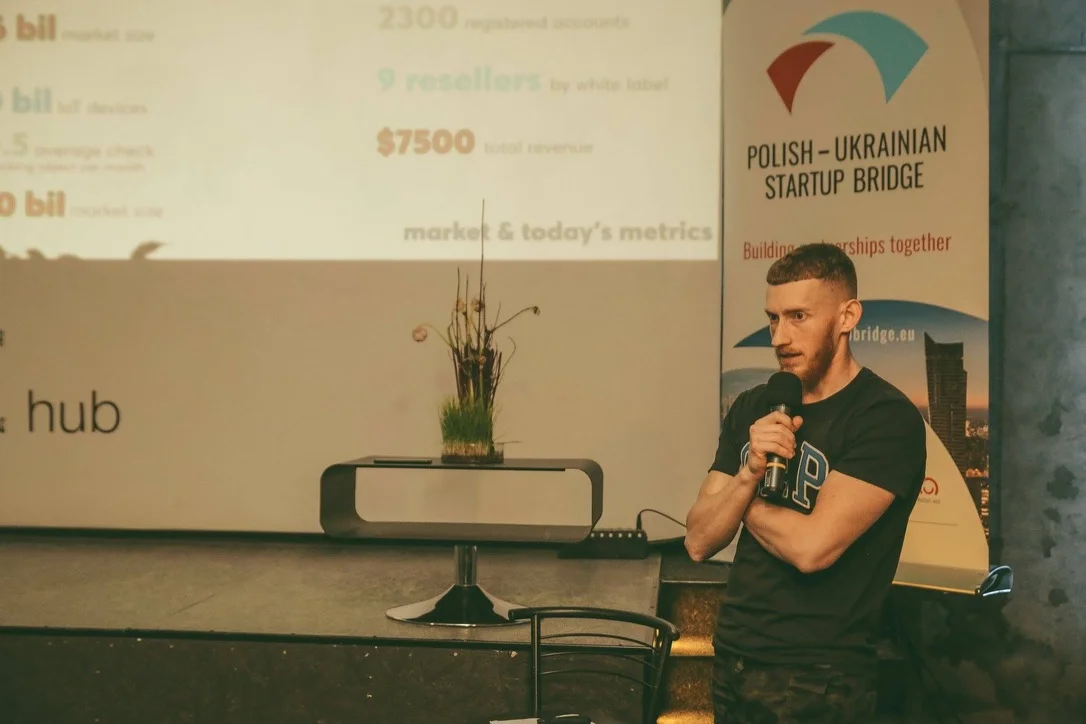
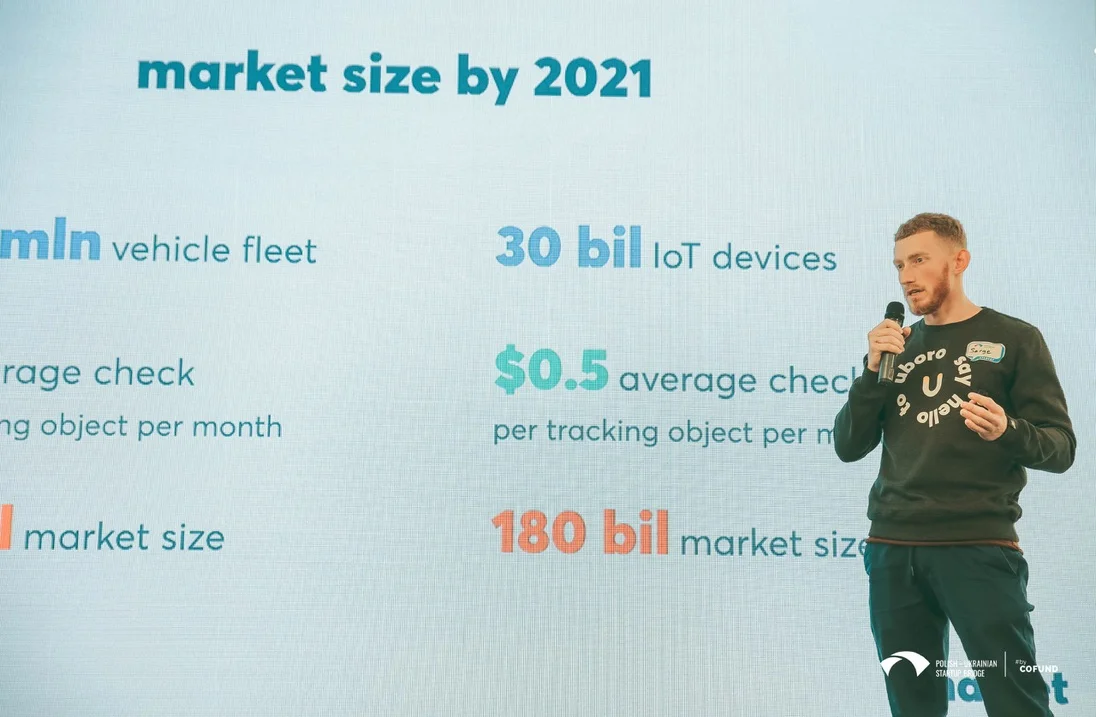
I spent years fundraising and pitching, at events across Ukraine and in Poland. In 2016 we raised a $200,000 angel round. Later Uboro was picked for the KTH Acceleration Bootcamp, and the Polish-Ukrainian Startup Bridge took me to the Startup Battle at Wolves Summit in Warsaw. To sell to companies abroad, I had to learn English.

I still remember our first payment: a user at a company in Saudi Arabia paid us $100. It brought the whole team to tears.

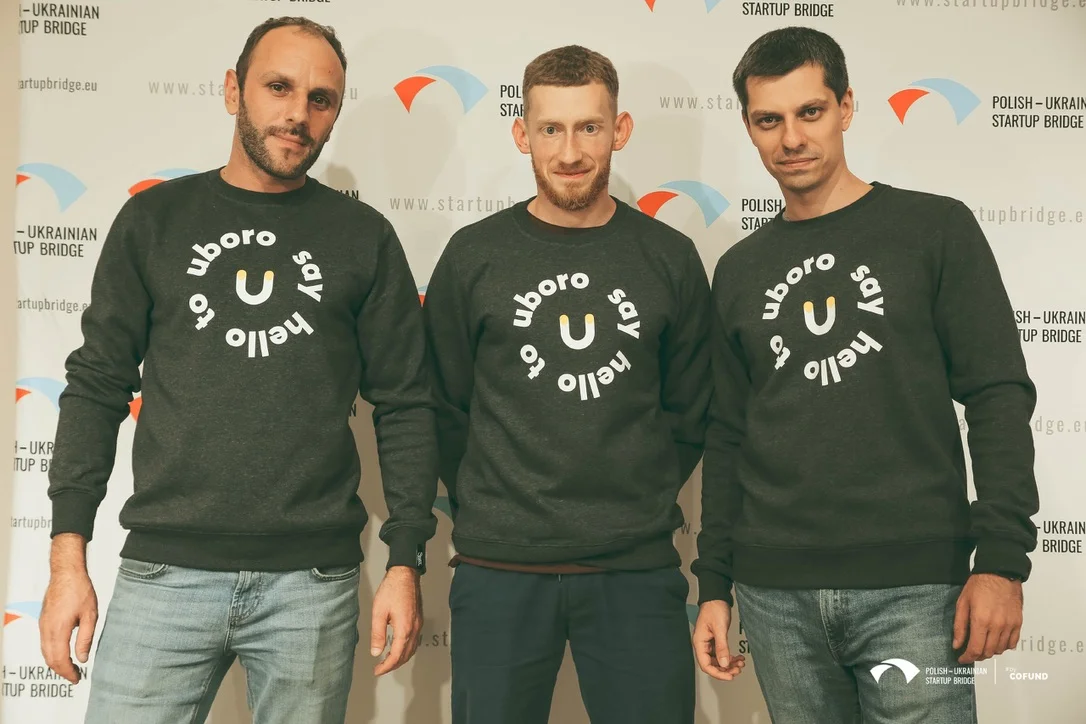
Our “Say hello to Uboro” sweatshirt, and the Polish-Ukrainian Startup Bridge, with my co-founders.

A lot of hats

Besides pitching, selling and running the team, I kept building. I designed Uboro’s screens and its marketing, from the website to the banner ads, and wrote the HTML and CSS myself, side by side with a full-stack engineer: I handled the visual layer, he handled the architecture. That’s where I became a product designer. Those were my first designs, but I think they still look cool.

Writing the visual layer myself, in code, stayed with me, and years later I came back to it in my article The design system problem.

Stage report
2.1Special
stage

Smartcat · Boston · 2021–2025

Eleven separate use cases became one product

I created Smartcat’s product-led growth funnel.

7% 85%Activation

55% 98%Task completion

0% 5%Conversion of the new self-subscription

Context

Smartcat had 11 standalone use cases (JTBDs), each with its own interface. The platform provided project management, team collaboration, and finance experiences that handled pay-in/out transactions across a 3-sided Marketplace of 500,000 freelance linguists. All these features were tailored for Fortune 500 enterprises and supported by an internal admin panel.

The bottleneck

The experience was outdated and sat on a rigid legacy architecture. Three groups of users who didn’t overlap each had their own product, and the eleven use cases, built in silos, added up to a broken experience as a whole.

Design system

I’ve created a comprehensive system for scalable and consistent growth of 11 existing use cases with the ability to rapidly add new ones.

Its shared components made design work 30% faster.

The design system supports 900+ Figma files

Currently adopting AI prototyping based on the design system that led to a rapid discovery cycle, allowing product managers and designers to brainstorm ideas without manual design.

Project dashboard experience

+107%Project completion rate

Latest
Unified “My first project” dashboard
V3
Quick translation project (“Curb Your Enthusiasm”)
V2
2021 Project dashboard, purple sidebar
V1
2020 “Space” project, no dashboard

1 of 4

Sign-up experience

+65%Sign-up completion rate

Latest
“Get a FREE 14-day trial”, split by audience (Business, Translation agency, University, Freelancer)
V2
“Create a Smartcat account”, email + social
V1
Plain login form

1 of 3

Home page experience

+74%CSAT

Latest
“Do something special today”
V3
Workspace home with photo header (“Accounting”)
V2
S.W.A.T. workspace with shortcuts
V1
Old purple app, new project screen

1 of 4

Project creation experience

+250%Activation rate

Latest
One-page “Create a project” form
V3
“Create a translation”
V2
Workflow template picker
V1
Old purple app form

1 of 4

Pricing experience

+500%Self-subscription rate

Latest
“Current plan: Forever Free”, Starter vs Custom
V4
Four-plan pricing table
V3
“Subscription plans” + extra Smartwords
V2
Smartwords options
V1
Old purple app subscriptions

1 of 5

Transformation case: Project dashboard

Creation of a unified project dashboard experience resulted in increased ease of use, improved completion rate by 107%, and reduced the amount of required maintenance.

Timeline

  1. 2020

    Projects without a dashboard

    Back in 2020, Smartcat lacked a dedicated project dashboard. All project assignments were handled through Files, making project monitoring a challenge. These projects were primarily geared towards professionals, making it difficult for beginners to grasp the platform.

    Newcomers often found Smartcat’s interface overwhelming, as it required an understanding of how localization products worked. In short, the user interface was far from user-friendly. Persisting with such an interface led to a limited audience and hindered any expansion efforts.

  2. 2021

    Launching the Project dashboard

    The Project dashboard was introduced in 2021, designed to function as a project monitoring hub where all project statistics could be gathered. This revamped interface was more minimalist and user-friendly, greatly assisting beginners in creating simple projects.

    However, a notable issue was that the Initial Project dashboard didn’t cater to the needs of professionals who continued to work with Files and Tasks. It lacked essential features for professionals, such as hiring and file management.

    Although the Overview was cleaner than the previous interface, it still contained excessive functionality for beginners. Furthermore, the Overview was built on an outdated component base, necessitating a redesign.

  3. 2022

    Dashboard for quick translation projects for practitioners

    To address the issues above, a decision was made to significantly enhance the user experience for practitioners and split Smartcat into two distinct applications – the Individual Application for practitioners and the Manager Application for professionals.

    Individual Application boosted a modern interface and introduced the Quick Translation Project dashboard, streamlining project creation and reducing confusion.

    However, a new challenge arose as users who became accustomed to the Quick Translation Project dashboard found it exceedingly challenging to transition to the old projects within the Manager Application. The audience separation had a negative impact on the progression of practitioners into professionals, and it led to the maintenance of two different user interfaces based on different technologies.

  4. 2023

    Launching the Home page and minimalistic Quick translation dashboard

    Recognizing the impracticality of continuing to segregate the audience into practitioners and professionals, we decided to discontinue Individual application and combine the Quick translation project with all other projects to create a unified navigation structure referred to as the home page.

    Users no longer had to switch between two different applications to work on various projects; they could see all their projects in one place. Project experience was further streamlined, and the newcomer experience was improved by eliminating unnecessary UI elements.

    However, we still faced the challenge of users transitioning from novice to professional. The Quick Translation Project dashboard lacked fundamental hiring and file management features. Consequently, users seeking more than automatic document translation were compelled to navigate to the complex Project Overview, which was ill-suited for basic scenarios and visually outdated.

  5. 2024

    Unified Project Dashboard

    The goal was to create a unified appearance for all project dashboards, ensuring that users can efficiently manage projects regardless of their complexity. Unified Project Dashboard bridges the gap between these experiences, enabling users to seamlessly transition from quick AI file translation to projects with customized workflows. This transition is as simple as inviting a contributor and incorporating a workflow stage.

    By unifying “quick” projects for practitioners and the workflow-oriented projects utilized by professionals, we’ve significantly simplified the user’s growth path. Users no longer need to adapt to a new interface when they require more sophisticated project management.

    The Unified Project Dashboard is designed on a contemporary, scalable component base. Its implementation has allowed us to eliminate the need for resources to support outdated code and UI.

  6. Next

    The AI project manager, in stage 2.3

Stage report
2.2Special
stage

Smartcat · Boston · 2021–2025

Team, principles and philosophy

How I built and ran the design team.

My design leadership principles

Empowerment
Find the right people, give them meaningful challenges and let them cook. People who find their own solutions become a high-performing team.
Culture
User-centered thinking through open dialogue, regular feedback and data-informed decisions, in line with company goals.
Team
Personal growth plans that stretch each designer’s skills and move their career forward.
Craft
The highest standards, with mentorship. Attention to detail and quality execution are non-negotiable.
Alignment
Design as a partner in decisions, with strong ties to product, engineering and the business.
Impact
Design decisions tied to business metrics and user needs, so design counts as a strategic function.

The cooking process

Beauty and function go together. A beautiful interface is easier to use, and care for the details people see shows care for the ones they never see. We reach for the ideal first, then plan practical steps. Reach for the stars, land on the moon.

Dual citizenship

Every designer belongs to their cross-functional product team, working with engineers and product managers every day, and to the design community, where they refine their craft.

Stage report
2.3Special
stage

Smartcat · Boston · 2021–2025

AI agents do the work, people check it

In 2024 Smartcat turned to AI agents, and I redesigned the product for it in three phases.

89%Of client companies adopted the agents, 1,200 in all, half of the Fortune 500 among them

The bottleneck

AI development threatened Smartcat’s core business, translation, and the product looked and worked like classic SaaS.

Smartcat set a strategy around AI agents. The teams across the company had to take in a new way of thinking about the product, and they needed to see it. So my team and I reworked the whole UX around agents, in prototypes and designs everyone could look at.

The call: upgrade what we already had

In phase one, instead of building agents from scratch, I upgraded project templates into agents and gave each one projects to run. We gave each agent a character, a picture of its own, and added an agent library. We rewrote the copy across the product so it tells the story of agents doing the job.

The chat became a way in too, almost like ChatGPT or Claude, which people had come to expect.

The product was complex, and the upgrade made it simpler. The price was people’s habits: users were used to the old way of working, so we accepted the cost of change management and of the learning curve.

The home page became the chat and a team of agents to pick from.

In phase two we designed the flows to create agents and chain them, gave workflows more power, and added more ways to do it all from the chat.

In phase three you give an agent a goal instead of a workflow, and it works out which agents and steps it needs.

The clearest example is the project manager agent. Reviewing hundreds of assets in dozens of languages means hiring hundreds of freelance linguists, then chasing them: who hasn’t accepted, who hasn’t started, who will miss the deadline. You tell the agent the quality and the deadline. It checks every task, checks in with people, drops those who won’t finish on time, finds new ones and assigns them, until every asset is done.

From upload to five languages

A customer needs an online course translated into five languages. Here is how the agents take it from one upload to done, and where people step in.

  1. 01

    Drop in the course

    “Create a project with these files.” The chat creates the project and offers an agent to run it.

  2. 02

    AI finds what needs translating

    It unpacks the course and shows the 11 assets inside it: six images, a video, three texts and an audio file. The customer picks what goes.

  3. 03

    An agent built for the job

    “I want to translate courses to five languages.” The chat builds a Custom Course Translator from the Course Translation agent, with its own steps for media, images and documents, and adds the five languages.

  4. 04

    Agents at work, in one view

    On a bigger project the dashboard is a tree of agents: 118 assets unpacked, then a media, an image and a document agent, each with the people who check its work.

  5. 05

    Every asset on one board

    Each asset runs its own line of steps in every language: transcribe, review, translate, review.

  6. 06

    A nudge before the deadline

    “It’s been five hours since you assigned the assignees… Let’s add backup assignees to make sure everything is covered.”

  7. 07

    People check the work

    A reviewer opens their task beside the lesson, edits the translation and marks it complete.

  8. Done

    Five languages, done

    Pulse, the feed of what happened, shows the course finished in English, French, German, Portuguese and Chinese.

Stage report
3.1Special
stage

Starbridge · New York · 2025–now · Leg 1

Core product redesign and Starbridge’s first design system

Rebuilt the core of a product built by engineers: first the feed, then how a Bridge is made.

~1 monthCoding the new feed, live in January 2026

2Designers hired once the feed shipped

2% 50%Users who set up their own searches, once Bridge creation was redesigned

Here is the work my team and I have done on Starbridge, up to November 2026. This report tells how it started.

1 of 10

The bottleneck

When I joined Starbridge, there was one designer and an outside agency. Engineers had built the product while the company was finding market fit, with no product design at all: no visual design, and no UX design either, where you create scalable systems. A lot of journeys were broken, there was no system behind the flows, and none of it scaled.

The design system was an open one (I believe it was shadcn), and every engineer had the freedom to change it. Nobody ever brought those changes back together.

The product itself was heavy: a lot of entities, a dense data graph, and concepts that ordinary users, with no idea how databases work, found really hard to grasp. The company had tried to fix all of that and it hadn’t worked, so they were looking for a head of design who had built teams before. That’s where I came in.

The call: name things before the screens

I did what the team later called my systems thinking, or architectural thinking, where I combine product skills and design. Before touching any design, I questioned and challenged the basics, and I built a scalable system around the features instead of fixing screens one by one.

Feedback on a polished screen (“Why is this here?” “Shouldn’t this be its own page?”) gets fixed on the screen, and the next review brings new questions. So I ask one question first: do you mean how it looks, or how it works? If it’s how it works, the problem is in the logic, in the ground the screen stands on. Two people can agree and then argue the opposite, because they’re each describing a different world with the same words.

So before anyone designs a screen, we draw an object model together: name one thing, check everyone means the same, and draw a box around it. Then connect the next one and say what the connection means. Does one contain the other or point to it? Can one exist without the other? Can one have many? Then the flow model: the objects chained into steps through the user’s eyes, one flow for each type of user. The rule: nothing can appear in the flow that doesn’t exist in the object model.

At Starbridge, the draft for email sequencing put manual tasks under the sequence, so no other feature could ever have a task. I asked how it works. Tasks moved to the account level and became their own feature, with their own entry point and screens. The plainest question on the board, “can a task exist without a sequence?”, would have caught it before any screen.

This is how I see the world and work through any problem. When things are named well, and their connections are clear, what you build can grow without being rebuilt.

I wrote about the object model and the flow model in more detail in my article Everyone agrees, nobody’s aligned.

Case 1: The feed

Starbridge finds buying signals for companies that sell to governments and schools: a board meeting, a budget line, a request for proposals. A Bridge is a saved search that keeps finding them, adds columns of data to each one, and sends them to people’s feeds. The feed was my first project, from October 2025 to January 2026.

A Bridge showed every column its builder had configured to every user, which confused the people who only read the feed. There was no way to filter signals out of a Bridge, say by score, and the feed cards had fixed fields that couldn’t show a Bridge’s columns. Subscriptions were managed one by one, and that stopped working for teams of twenty.

The feed, before and after: the signals that need action come first, with filters by status and Bridge, and one Configure my feed.

The call: builders and viewers

The fix started with roles. A builder makes a Bridge and gets two modes, build and view; a viewer only views. Changing a Bridge’s goal regenerates it and burns hours and credits, so that and the other destructive settings sit behind an impact warning; the settings that distribute a Bridge change all the time, so they sit right on the signals view.

One Bridge, before and after: the builder’s two modes at the top, and a status on every signal.

One sidebar mirrors how the card was configured: a table with twenty columns and a card with five gives a sidebar with five. Each signal carries a status, Needs action, Saved, Actioned or Not interested, and the email digest shows exactly what the feed shows.

The email digest, before and after: it opens on the feed’s own counts: new, saved and needing action.

The original plan had two concepts, Sharing and Subscription. I saw people subscribed to Bridges they couldn’t see, ten users looking at the same 43 signals with no idea who acts, and a second screen to manage subscriptions. My proposal: sharing a Bridge is access to its feed, with one “Configure my feed” and the email mirroring it. The team adopted it the same day.

The list of Bridges, before and after: the My Subscriptions tab is gone, and each Bridge shows who it’s shared with.

What I left out

The feed had to ship in weeks, so I cut filter rules per user, grouping, layout options, the graph and map views I was most excited about, and feed analytics. Title, status, date, type and buyer became fixed columns nobody can hide, and drag-and-drop ordering waited.

I turned down an “unread” state. Tracking it per user and per organization was complex, and the data said a cheap “saved” status would do: 85% of signals got a status change, but only about one user in ten ever set a status. Scoring, which filters the noise out of a Bridge, became its own project.

What changed

After about a month of coding, the new feed went live early in January 2026, behind feature flags, with a few visual gaps the team agreed to close after launch. It became the example the team pointed to when a later project had to ship faster, and the test I later gave the designers I was hiring.

One thing I knew was coming: as soon as the feed was live, most customers would ask how to filter the noise out of it. That was the next project.

Case 2: Making a Bridge

To make a Bridge, people had to write keywords as “phrase OR phrase”, not what they actually wanted, so customer success often built Bridges for them. When a search was badly structured, the results looked irrelevant and nobody could see why, and users decided Starbridge lacked the data. One of our customer success managers spent half an hour on every call explaining how accounts were scored.

Four things were wrong at once: people didn’t understand how a Bridge works, there was no safe place to try one, the processing of signals was hidden, and the filters were buried. Once a Bridge existed, almost nobody came back to improve it, and the system guessed what they meant; it never asked.

The project ran from December 2025 to October 2026, and it was the first feature I designed in the prototype environment: a clickable copy of the product that runs ahead of production. The copilot in the flow uses the same engine as the product’s chat, so engineers build from the prototype, not from a spec.

The call: ask in plain words, score in the open

My design, from December 2025: you say what you’re looking for in plain language, the system turns it into criteria, and each criterion becomes a column that shows a match or a miss with its reasoning. The score is simply how many criteria matched: eight of ten is 80%. You refine by editing the criteria, and the readers’ likes and dislikes flow back to the builder, where AI suggests what to change.

Every search shows real data at once and is saved as a Bridge, so you search broadly and narrow by score. I had already proved the idea on my own customer intelligence pipelines, where criteria like these cut the noise by 40%.

I argued for designing the whole system first, so that chat, Bridge creation and columns were made of the same bricks, and for criteria people can read over one blended score. The team’s call was to ship fast and learn, so we went in phases: a scoring column on every Bridge first, plain-language input next, refinement last.

What I left out

Speed shaped everything. Web agents take half an hour to research one candidate, and scoring a thousand of them live was out of reach, so previews run on twenty results with lighter models. Adding a search phrase regenerates the whole Bridge, so the agent appends to it where it can.

The first version covers one Bridge type, meetings, and shows a table only. The criteria columns I wanted gave way to a line of match reasoning on each row, because the columns kept changing as the backend evolved. And the feedback loop opens with the builder; the readers’ side comes later.

What changed

As of October 2026, that version is being built: a refined-search step with a table of candidates to review, a feedback module with set reasons, a score override and free text, and suggestions that arrive after the first piece of feedback. A new phrase brings new candidates, an edited criterion rescores everything, and a moved score shows before and after.

An agent in the flow can change phrases, filters, buyers and criteria without losing the signals already found, and you can save at any point, in a sandbox that says so. Where it goes: an agent inside every Bridge, watching its health and refining it on its own once the score drops below about 75%.

So far, the share of users who set up their own searches has risen from 2% to 50%.

The design system

I was still designing in Figma in those first months, so along the way I built Starbridge’s first design system: one set of components in place of the open one every engineer had changed. With the feed we unified a lot of those components and refaced the product, so it started to look like one product. The system later moved into code, where the design team owns it.

Part of the product’s design system as it lives in code today: 160 of its 236 components, with two parts up close.

The team

When the feed shipped, everybody was pumped. Then I grew the team: I hired two excellent designers, the best I’ve worked with in my whole design management career, because they were so mature. The screens we’ve made since are the proof.

The factory

Looking back, everything after this was about the bottlenecks of one machine. Imagine the company as a factory that produces software, or provides a service to its customers. I was the person walking along the chain of stations where the product is built or the marketing is delivered, clearing the next bottleneck.

Stage report
3.2Special
stage

Starbridge · New York · 2025–now · Leg 1

Prototype environment

Moved the design system into code and built a prototype environment on it. The design team left Figma.

3–5xFaster design on the first feature. 9–10 weeks of work done in 3.

5–10xMore complete specs in Linear, written from the prototype

8 monthsDesigning without Figma, and counting

The bottleneck

The main trigger to explore a new way of designing was a problem I had at my previous company: the design I created was never delivered the same way by frontend engineers. I worked there for four years, and it had started to feel like the status quo, as if there was no way to change it. I thought I might see something different at a new company, but I saw the same way of thinking and the same way of working: frontend people who just don’t see the difference between the design they were given and what they deliver.

Two ideas

I thought it would be great if at least the design team could own the design system, so that at least its components are pixel perfect and engineers can’t change them. And I saw the opportunity, because Claude had become capable of doing that.

Craft matters: users feel it, even if they can’t name it. They sense that someone cared. But a design system drifts from two directions. The designer’s small tweaks run ahead of the code, and what’s delivered never quite matches, so every design review costs the same time again. This isn’t about blame. The dream was never “sync Figma to code”. The dream was ownership: one source of truth, one owner.

I wrote about this in more detail in my article The design system problem.

My other idea was a prototype environment, where I would make prototypes with the same design system, and those prototypes would help teams reach alignment. I kept seeing the same problem between stakeholders: they discuss things with no visuals, and each of them imagines their own picture of the world, or of the designs. Having designs ready, on the table, helps drive alignment in a discussion much, much faster.

So the idea was a prototype environment and a design system controlled by design, which would serve both the prototypes and the production code.

Building it

I started looking for a way in February 2025, and it took almost a year to get there. Every AI design tool I tried worked in a very controlled demo, then fell apart on a real product with a design system, a team and years of decisions. Claude Code took me a while too, because everything I work with lives in the cloud, not in files on my computer.

In February 2026, Opus 4.6 made Claude Code much better, and I tried it anyway. This time I saw it as an environment, one I could configure and shape to work the way I think.

I built this environment with Claude Code, where I could compile my own design system code. The first thing I did was move the whole design system I’d built in Figma into it, component by component, matched pixel for pixel in Storybook.

Then I wrote the design guidelines: spacing, color tokens, layout, how the product should feel. That’s when I saw it: this is my design work. I wasn’t setting up a tool. I was setting up a design environment.

At first I thought we would prototype in the new environment (I was basically stitching pages together in code) and I would still maintain the design system in both places, in code and in Figma. But I quickly realized I didn’t need to, because I could build the design system faster in code. So I had to maintain just one source of truth.

I moved step by step the whole way, until I reached the point where I stopped using Figma for design.

The year it took has its own article, Three weeks instead of three months.

The prototype environment’s project.

Part of the project is a dev panel I built. Its inspector reads whatever you point at: the component, its font, its colors and the contrast between them. The rest of the panel holds feature flags, experimental features, a role switcher and controls for the sample data, down to a clean slate. With it, we can test the product in different states.

The dev panel’s inspector, and its menu for the sample data.

The first feature

The first feature I designed in this environment was the new way to make a Bridge, the second case in Core product redesign, and it was a complex one. I did the UX, the design and the prototyping about three to five times faster: it would have taken me nine or ten weeks, and it took three. On March 24, 2026, I handed off the complete feature: research, UX flows, a working prototype, feedback rounds and pixel-perfect designs. The whole design cycle, and I didn’t design a single screen in Figma.

I rewrote the PRD into my version of the solution, gave Claude Code the guidelines and the requirements, and let it plan and build. It built precisely what I’d described, and it looked like our actual product. It was like having a junior designer who actually read the brief.

The time I saved is great, but what surprised me more was how this new way of designing changed the way the feature was built, and how the discussions around it shaped it. We could iterate a lot more, and test our thinking and ideas with real prototypes. That part inspired me even more than designing faster.

A Figma prototype is a picture of the product. It’s not the product. When I showed this one to the team, they weren’t imagining how it would work. They were using it. Most of my time went on feedback rounds, not on building: a change asked for in a meeting, shown ten minutes later. The speed meant I could afford more rounds.

I wrote about how the feedback changed in my article Designing without drawing.

Specs that write themselves

Once I had a pixel-perfect flow in the prototype environment, built on the design system, I could file the design specs, which I did in Linear. That used to take another three or four days: annotating all the flows, assembling tickets, making user journeys with screens. I did it fully automatically, and it saved me several more days.

And what I made was five to ten times bigger than what I would make by hand. Designers usually don’t want to do this: it’s a monkey job, and you can never describe every edge case and flow. But since every flow was already prototyped in code, Claude filed those specs for me: it wrote each ticket from what had just been built, every state and edge case, in minutes.

Those specs now also drive automated UI tests.

One of the design specs Claude filed in Linear.

The plan was UX in Claude Code and pixel-perfect design in Figma. Frontend asked: will there be pixel-perfect designs in Figma for handoff? That was the plan. It didn’t survive the week. The fast iterations had made the feature much wider than usual: in Figma it would have meant hundreds of screens, and the scope would have been cut long before. The prototype is the design. The last mile didn’t need solving. It didn’t exist.

The rest of the handoff story is in my article The last mile, and what came after.

From prototype to production

Once the prototype was the design, we built Claude skills with the frontend team that turn prototypes into production frontend code, and the quality of the production frontend went up a lot.

Gradually, the prototype and production are moving toward one shared design system. Until then, the skills save us a lot of time: the prototype goes to code automatically, and we chase frontend engineers far less to make the code match the design.

Moving the whole team

After that, I convinced myself, my team, and the product and design team that we could move the whole design team off Figma and onto this flow. That’s where all the challenges came up. It’s easy to work in your own sandbox, but with other designers you have to manage pull requests, GitHub, shared skills, environment variables, packages and so on.

I also found that every designer works very, very differently. We always knew that, but I rediscovered it, because it started changing what Claude produced. It was an interesting problem to solve.

To make it safe, I added a skill that checks the prototype against the design system, and a checking loop: some of the time Claude behaves like a senior developer working alongside you, the rest of the time like a ten-year-old kid with your prototype. Then a setup guide and a contribution guide (branches, commits, pull requests, the design guidelines), with Claude Code reviewing every contribution. The first to join were one designer and one product manager from our team, and I’m proud of them for agreeing to go through the learning curve.

What changed

Three to five months after I started the prototype environment, we moved off Figma. The pace, and the change in how the team thought, were fascinating to watch. When I started out, fixing design quality problems, I couldn’t have imagined how much this change would do to the team’s processes.

Product managers start prototyping

We found something else, too. Product managers started using the prototype environment to develop their thinking, working through their PRDs at the very early stages. Instead of only describing what they think the problem is and what we need to do, they prototyped their ideas in the same environment, again to drive alignment with stakeholders. Instead of sharing just a Google Doc, they shared a prototype of their idea, and it looked like the product, because it was built with the whole environment and design system.

So it changed the product team’s speed tremendously too, and, most important, how fast we reached alignment and shared understanding. One product manager’s prototype landed better than a million words in any PRD or presentation.

Today

As of November 2026, I haven’t used Figma at all for eight months. This was the design prototype journey: tooling that changed several dimensions of how teams work.

Where it goes: product managers prototype instead of writing docs, sales engineers build concepts live with prospects, and the environment becomes the North Star, always slightly ahead of production. One day designers contribute CSS and components to the frontend, reviewed by frontend engineers. I don’t know how long it takes to get there, but I’m already going. We won’t ship more screens. We’ll ship better decisions.

The environment also became the ground for everything I built next for marketing: a website rebuilt on the same ideas and run from Slack, product graphics made straight from the prototype, and an asset library with one design system for all of marketing.

Stage report
3.3Special
stage

Starbridge · New York · 2025–now · Leg 2

Customer intelligence pipelines

Pipelines that read every customer call and trial email overnight, check each signal twice, and brief each team in Slack by morning.

20,527Signals kept, from 776 customer accounts

1 in 4Candidates the quality check agent throws out

3 lanesExisting customers, onboarding and sales trials

The bottleneck

When I led product at Smartcat, I kept seeing the same thing. Some companies build around truly empowered teams; most run a feature factory, where leadership and senior stakeholders bring the ideas and the product team turns out features. Research across the whole customer base was hard to do, so the loudest customers and the strongest opinions filled the backlog and drove the roadmap.

What customers actually said got filtered through summaries until a product manager saw a sanitized version weeks later: an elaborate system for losing customer insights at scale. Most of it never left the call recorder, because nobody had time to replay the calls, and a big sales trial could go quiet before anyone noticed. I wanted signals, then problems, then solutions.

The first version, at Smartcat

Every customer call was recorded, so the idea was to pull the signals out of them, and my team proved it by hand first. Working across three product teams, we took one quarter of them, 400 calls with 100 subscribed customers, and one of my product managers helped write a Python script. We got about 900 signals, clustered them into a backlog, and the OKRs were built on the problems we pitched to leadership.

None of the 10 to 12 tools I then tried could do it for us. Most had AI sprinkled on top, like engines bolted onto carriages, and the one built around AI broke after three weeks of real use while it appeared to work perfectly.

So I built my own in n8n, back when AI was far less capable than it is now, and it found more than 8,000 signals, though Smartcat never adopted it. Building it yourself has a cost: you own the maintenance, the bugs and every feature, so I weigh build against buy each time.

I wrote about the tools I tried and the one I built in my article Why I’ll never buy SaaS again.

The call: build it again

When I joined Starbridge, I offered to build it, and the answer was: yes, sure, let’s do it. Nobody could see the impact yet, so I built a quick prototype with Claude Code on our customer success calls.

It changed how we hear our users. From that prototype I built the whole system myself with Claude Code, and I still run it: the workflows in n8n, the database, the web app, which I designed too, the Slack briefs and the connector to Claude. Because it was all mine, I could fix it the moment something broke and slice the data any way we needed.

The calls gave us two kinds of signal. Praise and results lifted the team’s morale, because they were real quotes from people who liked the product, and they gave marketing customer stories, case studies and testimonials. Feature requests, complaints and problems with the experience went into a backlog.

When you do something that was impossible before, it changes how people think. Other teams asked for signals from their own conversations, and the pipeline grew a lane for each kind:

Three lanes

Existing customers
Customer success calls: the results customers got, new ways they want to use the product, and where it fell short.
New customers
Onboarding calls, right after the sale: where the handoff from sales went wrong, with a customer oversold, over-explained or confused, very often about how AI credits work.
Sales trials
Trial calls and trial emails: what wins a prospect over and what puts the deal at risk, so sales can react to a problem before it grows.

One conversation, overnight

On October 30, a customer told us on a call: “We increased our contact pool in our target states from like 500 to over 1,200 just overnight.” By 2:16 the next morning, the line was a card in Slack, linked to that moment in the recording, and at 6:08 it was the standout quote in the team’s morning brief.

That line is a signal: one thing a customer said that the business should know, kept in their exact words with a link back to the call or email.

Getting a line from a call to a card by morning takes a night shift of 15 workflows in n8n, a tool for building automations out of boxes on a canvas, and every conversation is read twice. A note-taker listens to the customer’s side and writes down candidate signals.

A quality check agent then checks each one against the transcript and tries to knock it down. Is it happening now, or is it a story about the past? Is it about Starbridge at all? Did the rep already show that the product does it? Is there an exact quote behind it?

The agent is strict: it has thrown out 7,579 of 28,106 candidates, about one in four, and it records why for each one. Every card in Slack carries the agent’s verdict and its reasoning beside the customer’s words:

What the AI listens for is a dictionary of 21 categories, each defined in plain English, so changing what it looks for means editing a definition, not code.

Slack, the web app and Claude

Each lane has two Slack channels: one for the cards, and one where a brief arrives around 6 a.m. Eastern.

The brief sums up the day, picks the standout quotes and sorts every theme into four buckets: what customers liked, what frustrated them, what confused them and what they asked for. The brief of October 31 carried the contact-pool quote among its standouts:

On Mondays, a weekly brief marks each theme as growing, steady or fading.

The web app holds the evidence. Open any signal, read the quote and press “Play moment” to hear the customer say it.

Anyone can also ask Claude about the same data, in Cowork or in Slack, through a connector.

Keeping the AI honest

An AI that reads thousands of calls will be confidently wrong some of the time, so people correct it right under its cards. On October 28, a customer success manager replied under a card about a user “left out of the rollout”: the customer had been joking, and that user was one of their happiest. The morning brief had already quoted the line.

Corrections become written rules. In October, reviewers flagged six praise cards that weren’t real praise, and they became four new rules in the dictionary, live on October 29. One of them: a purchase or a renewal is account news, however warmly it’s said. Each change is tested on past calls before it goes live.

What changed

By November 1, the pipelines had read about 4,500 calls and 183 batches of trial emails and kept 20,527 signals from 776 customer accounts, lately about 150 a working day.

The web app’s dashboard, week by week.

The team that owns onboarding keeps improving its own processes wherever the signals show a bottleneck. In sales trials, reps react to what’s happening while there’s still time, and sales leadership sees how each trial is going and coaches the reps. Customer success managers and salespeople use the signals to work their accounts, to sell and to find examples.

Product and the rest of the company use them too, more often in Claude Cowork than in our web app, to research a topic and dig into its details. Since late August, Claude has looked things up with the connector about 8,000 times, mostly finding calls and reading their transcripts.

The backlog of 1,346 problems and opportunities feeds the roadmap, and our decisions and discussions rest on real data, which makes them far more efficient. A problem someone brings us is no longer taken on trust: “a customer said” becomes a count of the customers who said it, with their words one click away.

The backlog for customers last week, and the graph that joins them to their needs.

The signals reflect what’s really happening with our customers, and they keep our teams grounded in reality, not delusional about it.

Stage report
3.5Special
stage

Starbridge · New York · 2025–now · Leg 3

Marketing website, run from Slack

Rebuilt the marketing website with Claude Code in five days, then handed it to marketing through Slack.

~210 pagesRebuilt in five days

6Marketers onboarded

Weeks dozens a dayHow fast website changes ship

The bottleneck

Starbridge’s marketing website ran on Webflow: about 210 pages, looked after by a marketing team of people who don’t write code. A new page took at least a week, and our CMO remembers why:

“Someone wrote the copy then passed it over to brand who would then send a Figma file to a third party agency to build and publish in HTML. If the page needed product graphics, every product feature had to be redesigned piece by piece in Figma for marketing use. If we really wanted to get crazy and do some animations, we would need to hire a separate animator.”

Every change went through a ticket, and what came back rarely matched what was asked for. Everyone knew how hard any change would be, so nobody wanted to touch the design, and the site slowly got worse.

The call: build it like the prototype

I already looked after a much harder website on my own: the prototype environment, a working copy of our product with its own logic and a lot of pages. Next to it, a marketing website was simple.

So I rebuilt ours with Claude Code in five days, on the same ideas as the prototype: a design system, systems thinking and templates for every page. Claude would be the marketing team’s main tool for the website.

The marketing website’s project.

Live on September 10

When the rebuild was done, I asked the team to try to break it:

The site held up, and our engineering team made it production-ready. They checked that the move wouldn’t cost us our search rankings, and put the site on the company’s deploy infrastructure.

Vibe-coding something big for fun is easy now. A production site has to be durable and secure, and for that you need your engineering buddies.

The new site went live on September 10, and our CMO announced it to the whole company:

Leaving Webflow had made our CMO nervous: “I didn’t know if we could pull it off, and I was worried about our SEO. … Our SEO even improved!”

A Slack channel for the website

I had built the prototype in a terminal, and a terminal scares people who don’t write code. Anthropic’s Claude Tag lets Claude join a Slack channel as a team member, so I opened #website-dev, and it became the marketing team’s way into the website.

Marketers come into the channel and tell Claude what they want in plain words: change the copy, add or move a logo, add a client or take one off, add a blog page. Slack made the work a hundred times simpler.

I set the channel up with four things: written instructions for the channel, access to the website’s code, a Claude environment in our company’s account, and rules for what Claude may do without asking. The move was mine from the first page to the release, and I onboarded six people from the marketing team.

What changed

The day after the site went live, #website-dev blew up. Marketers asked Claude for one improvement after another, and the more they saw was possible, the more they asked. Our COO joined in: “can anyone do stuff like this^ lol? like could i come in here and be like ‘make the website green’”

Changes that used to take weeks now ship by the dozen every day, and the team’s sense of what’s possible, and of how long things take, changed with them. They come up with ideas differently, test pages to bring in more traffic, and make pages on the fly for each group of people we target with ads. It’s insane how much the marketing process changed.

Our marketing designer builds pages in HTML and ships them from Slack, and our CMO sees the change in the small jobs: “Because Claude can read our entire site, we catch typos, odd punctuation, and missing images with one prompt. Updating our customer count across 100 pages takes one prompt as well.”

My favorite request came from our COO a week after launch:

Six weeks in

I posted the numbers in the channel:

Over 32 workdays, that’s two or three releases to production a day.

The channel’s biggest test came on the morning of the Starbridge 3.0 launch, with a list of last fixes and a few hours to go. That story has its own article: What a product launch looks like in an AI-pilled marketing org.

Stage report
3.6Special
stage

Starbridge · New York · 2025–now · Leg 3

Product graphics

Turned the prototype into the source of product graphics that stay as current as the product.

54Product graphics in four weeks

Still or animatedA still of one screen, or a walkthrough of a whole flow

HTMLFlows from Storybook tests, sharp at any size

The bottleneck

Product graphics used to start in Figma. Our product designers drew each one by hand and handed it to marketing, and it went onto the website, into launch materials and, most of all, into the help center, across a huge number of articles.

The moment a graphic was published, it was already old. We usually launch the first version of a feature, and it grows into something bigger right after.

Nobody owned the job of keeping up. Marketing launches features and explains them to users, so product marketers and product managers kept pulling at the same questions: who owns the story, who writes the help center articles, which story to tell, and who makes the pictures it needs and keeps them current.

The problem had two halves: the copy, which tells the story, and the product graphics that back it up.

The call: make every graphic from the prototype

I ran into the problem myself while rebuilding the marketing website: it needed good product images, and we didn’t have them. We did have the prototype environment, a full copy of our product in code, and Claude could already build any screen of it, or any piece of one.

Flows were harder. To show someone clicking from one page of the product to another, we still made a recording by hand in Screen Studio, the app our marketing team used for polished demos.

But Claude already clicked through our flows on its own. In Storybook, where our components live, it keeps each flow as a test, and to prove one works, it goes through it button by button.

Each of those tests is a recording of the flow in HTML, so it exports straight into a product graphic that stays sharp at any size. The website plays that HTML as it is.

I built that export with Claude Code, and it edits each graphic the way our team used to edit a recording: the camera zooms in on each click and back out, the pointer looks like the one Screen Studio draws, and the scene holds on its last frame. That’s why the graphics look recorded by hand.

A product graphic, exported from a Storybook test: Ask Starbridge researching a buyer’s procurement path.

A Slack channel for graphics

Everything underneath already existed, so letting anyone at the company order these graphics took me only a few skills and a few tools stitched together: MCP servers that serve the design system and the product, and Claude Tag, which brings Claude into a Slack channel as a team member.

In #product-graphics, people ask for a still of one screen or a walkthrough of a whole flow. They describe it in words, or record themselves clicking through the live product. Claude rebuilds it from the prototype.

Nothing gets built before the person says go. Claude asks its questions one at a time, then shows a storyboard of every step.

Behind the channel, each request gets a fresh copy of the prototype on a cloud machine that runs Storybook and a browser. The finished graphic lands in the asset library under the requester’s name, waiting for the marketing team to approve it.

How a product graphic gets made.

One request, start to finish

Our marketing designer wanted to replace an old hand-drawn visual that didn’t look like our product, so they asked in the channel:

Claude chose the card that shows one buying signal and built it from the prototype, so it matches the product exactly. Like every product graphic, it came as HTML and a PNG, and the HTML stays editable, so we can adjust it later for a single page of the website.

The editable HTML pays off in sales decks, which our sales team now builds in Claude Cowork. When Claude pulls an approved graphic into a deck, it can tailor the screen to the client first: their own domain, their total addressable market or the buyers they sell to. On the slide, the product then supports the pitch for that one client.

Always up to date

The help center had the most annoying version of the problem. Its articles are full of product graphics, and every design system update or slightly changed flow leaves some of them wrong. Redoing them across every article cost so much that nobody ever wanted to.

So I built an agent that watches the product all the time. When something changes, it makes new graphics and swaps them in for the old ones in the library. Once the marketing team approves them, the new versions show up everywhere the old ones were used.

It saves the entire product team I don’t even know how many hours and brain cells, and this small tool made the work of both the product and marketing teams a joy.

In the four weeks from October 5, Claude delivered 54 graphics in #product-graphics: 49 stills and five animated walkthroughs.

The procurement-path animation went into the Starbridge 3.0 launch. How the whole launch came together in about two weeks is in my article What a product launch looks like in an AI-pilled marketing org.

Stage report
3.7Special
stage

Starbridge · New York · 2025–now · Leg 3

Asset library and the marketing design system

Built an internal asset library and grew the website design system into one for the whole marketing organization.

1,136Assets in the library, as of November 1, 2026

9Team members making materials with it

1 systemFor the website, slides and social posts

The bottleneck

Marketing serves a lot of teams: sales, business development reps, outbound, its own ads. It sets up templates, like a master sales deck full of example slides, and people make their own versions for each customer.

AI made that even easier, and the more versions people made, the further their materials drifted from the brand. Before AI, companies bought digital asset management tools to keep this in order.

Pulling it all back took more than one tool: a design system connected to everything people make, and images marketing has approved for wide use.

The asset library

Once product graphics came straight from the prototype, they needed a home. I designed and built an asset library with Claude Code, an internal web app that holds every image the company publishes, and the marketing team looks after it.

Everyone else reaches the library through Claude. Each person connects it with their own Google sign-in, so Claude always works as whoever asked. Someone who needs a deck, an outbound email or a social post asks for it and gets the images that fit.

How the asset library reaches Claude.

The graphics people order in Slack land in the library under their own names. The marketing team reviews them in the library’s web app and approves the ones the company can use, and the approved images feed the website and everything else marketing makes. Each image carries purposes that say where it may go (the website, social posts or everywhere), and its page shows where it appears right now.

Each image also carries concepts, our name for the topics we write about, like K-12 procurement or customer case studies. When the marketing team writes a blog post with Claude, its writing skill finds the images whose concepts match the topic and pulls them in on its own.

Anyone at Starbridge can sign in and download an image as it is, or a marketing version framed on one of our brand backgrounds, in the size they need.

One image, framed on two brand backgrounds.

The product graphics in the library stay reliable, because each one is built from the current prototype. And the prototype matches the product or runs slightly ahead of it, which suits marketing and sales even better.

A design system agents can use

Alongside the library, I grew the marketing website’s design system into one system for all three of our brands and everything marketing makes. It runs the sites for starbridge.ai, Bridges Media and the Bridges conference, and it covers website pages, emails, social posts and slides, each with its components, examples and guidelines.

It lives in Storybook as real HTML components, each with instructions for Claude on how to use it. An agent building a page or a banner reads the component itself, with its exact spacing, type and color, so what comes back is pixel perfect.

Part of the design system in Storybook, and how it reaches Claude.

Agents reach the system through one hosted MCP server that lists every component and its props, so Claude Code, Claude Cowork and Claude in our Slack channels all work from the same pieces.

Every request for something branded goes through one skill, a file of instructions Claude reads before it starts. Its rules are short: name the surface first; if the system doesn’t have what you need, stop and flag the gap; a prop that isn’t documented doesn’t exist; never redraw the logo; never invent a metric, a customer name or a quote.

For my article about this work, I asked Claude for a LinkedIn graphic:

The headshots came from the asset library.

What changed

Together, the library and the design system changed how the whole company makes content: whatever comes out is on brand and pixel perfect, product graphics included.

The marketing team now decides what it needs, asks for it in plain words and judges what comes back, and Claude does the building. People who don’t write code use the whole stack, from the prototype to production.

Our CMO puts the result this way: “We ship faster, and our design is better than it’s ever been. Same size team. Yet our output and quality has risen.”

The Starbridge Design Universe

The prototype environment, the customer intelligence pipelines, the website, the product graphics, the library and the design system had grown across so many Claude sessions that I was losing sight of how the pieces connect, and I was their only owner. So I drew a map of everything the design team and I made for the other departments of our software factory, and called it the Starbridge Design Universe.

All of it first worked together on the Starbridge 3.0 launch: two people on the marketing team made everything in about two weeks, where it used to take us a month or more. How they did it is in my article What a product launch looks like in an AI-pilled marketing org.

Stage reports

Every stage, in full

The story behind each one.

0Prologue

Kyiv · 2006–2014

Prologue

I chose a rally headquarters to tell my career, because eight years of timing rallies and tracking every car forged me, years before I stepped into product management and design.

Status

Finished

3Skills I came away with: a builder’s mindset, thinking from first principles, and carrying pressure through chaos

0.1Special
stage

Prologue · Kyiv · 2006–2014

Where I became a builder

In my last year of university I built a rally timing clock. Then I built the equipment that timed every car and the GPS tracking that made rallies safer.

Status

Finished

The bottleneck. There was no reliable way to keep every clock across a rally in sync, and in rallying, time is everything.

Control times · the big numbers
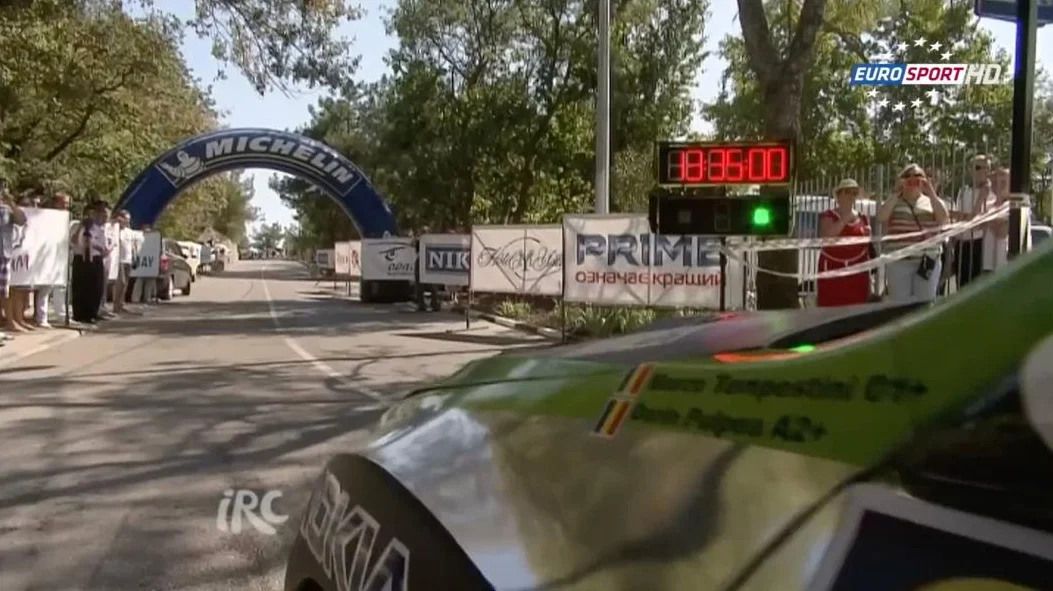
112Rallies timed
35Clocks across the Yalta Rally, 2012
A rally car at a start in town, the clock beside it with a green light and spectators behind the tape.A white car at the start line beside the clock, with a blue Michelin arch over the road.Another car pulling away towards the arch, with the clock to the right and cliffs above the road.The view from inside a car at the start, with the clock to the right.
Stills from Eurosport’s coverage of the Yalta Rally. The box under the time counts down the five seconds before the start, with yellow and green lights.

The story

Each clock was synced by hand: a special crew drove around the rally, switched the clocks on and connected a computer to each one to set its time. If a clock switched off during the rally, there was no quick way to switch it back on with the right time. So clocks often fell out of step, and that caused a lot of problems with the results.

My idea was to take the time from GPS satellites. That way, it no longer mattered if a clock switched off: as soon as it was back on, it took the exact time from the satellites, the same time every other clock showed, wherever it stood.

It was a long black box on a tripod, with big red seven-segment digits and fluorescent lime-yellow caps at each end. The caps shaded the digits from the sun, and closed over the display like lids when the clocks traveled. I built them and wrote their software. They stood at the start and finish lines and at every time control, where crews get their time cards stamped.

That clock led me into timing rally competitions. There I built new timing equipment to replace the old: it recorded each car’s start and finish and printed the times on the spot. That printout was the official proof of who won. Then I took on another problem: safety. A rally spreads across a whole region, so after a crash it was hard to find out where it happened. I designed and built GPS trackers for the cars, and software that showed every car on a map at headquarters. From then on, if a car crashed, we could see where right away, and that made the rally much safer. Years later, that tracking software became my startup, Uboro.

A rally is a small society for a weekend. It takes a lot of money and hundreds of people, and the government too, because we close public roads. It takes months of planning. Then it goes live, and it can’t stop until it ends. Cars race through the stages, marshals stamp time cards, headquarters tracks every car, and the service park fixes them. On race day, the whole rally ran on the clocks, the timing and the tracking I built. One mistake can break all of it, and everyone feels that, at every level.

The peak was the Yalta Rally in 2012, a round of the Intercontinental Rally Challenge, shown on Eurosport. Two days, factory teams, about a thousand people organizing it, a budget of around ten million dollars, and observers from the FIA, the sport’s world governing body, there to keep it at the series’ level. At noon on the first day, all 35 clocks across the rally froze at 00:59:59. They had lost the satellites, and I couldn’t find out why. For the next hour I felt every bit of the pressure, and the guilt: the clocks were mine, and ten more minutes of it would have canceled the rally. At one o’clock they came back on their own.

That night I searched for the cause and couldn’t find it. We knew it would happen again at noon, so for the second day we issued a bulletin, the official notice to every crew: a pause from noon to one. At noon the clocks froze again, right on time, and the rally waited. Back home, with fresh eyes, I opened one clock and found the bug at once: one comma in the wrong place. The clocks ran on a microchip I programmed in assembly language, where you write every instruction for the chip by hand, down to single bits, so one misplaced comma was enough to stop everything.

I lived through many days like that, ten to twenty-five rallies a year, and year after year, pressure stopped overwhelming me.

1Rally

Kyiv · 2014–2021

Uboro

I founded Uboro: GPS tracking for companies and their fleets.

Status

Finished

0 1Founder’s mindset, used in every job since

1.1Special
stage

Uboro · Kyiv · 2014–2021

Rally to fleet tracking

I founded Uboro: GPS tracking for companies and their fleets.

Status

Finished

The bottleneck. Fleet-tracking software was either outdated or very expensive.

Control times · the big numbers

70,000Objects tracked at its peak
4,000Cairo cab drivers studied with Uber, on Uboro’s app
5People on the team
A dark green sweatshirt on a chair, printed with the Uboro U inside the words "say hello to uboro" in a circleThree men in matching "say hello to uboro" sweatshirts in front of a Polish-Ukrainian Startup Bridge backdropPitching with a microphone beside a Polish-Ukrainian Startup Bridge banner; the slide behind reads 2300 registered accounts, 9 resellers by white label and $7500 total revenue, under "market & today's metrics"On stage in the Uboro sweatshirt, in front of a slide headed "market size by 2021": 30 bil IoT devices, a $0.5 average check per tracking object per month and a 180 bil market size
Our “Say hello to Uboro” sweatshirt, and the Polish-Ukrainian Startup Bridge, with my co-founders.

The story

After the Yalta Rally in 2012 and the Aleksandrov Rally in 2013, colleagues from across Europe noticed my rally tracking and wanted to use it at the European Rally Championship. The final tests were planned for 2014. That year Russia occupied Crimea and invaded Ukraine’s eastern regions. Racing in Ukraine stopped, and my rally tracking had no rallies left. We left behind everything that only a rally needed, kept what a fleet could use, and built on top of it. You paid by the day, only for what was being tracked.

As a founder I ran sales, marketing and the team, and I kept building: I designed Uboro’s screens and wrote their HTML and CSS myself. That’s where I became a product designer.

2Rally

Boston · 2021–2025

Smartcat

I joined Smartcat, an AI translation platform, as head of design. I went on to optimize its product-led growth, then also became director of product: I led 30 engineers and designers in five product teams and owned the product for its marketplace of 500,000 freelance linguists.

Status

Finished

$0.5M $15MSmartcat’s ARR while I led product and design

2.1Special
stage

Smartcat · Boston · 2021–2025

Eleven separate use cases became one product

I created Smartcat’s product-led growth funnel.

Status

Finished

The bottleneck. Eleven use cases built in silos, three user groups that did not overlap, and activation at 7%.

Control times · the big numbers

7% 85%Activation
55% 98%Task completion
0% 5%Conversion of the new self-subscription

Five transformation cases · each one a before and after

Project dashboardProject completion rate+107%
Sign-upSign-up completion rate+65%
Home pageCSAT+74%
Project creationActivation+250%
PricingSelf-subscription+500%

The design system

One design system for all 11 use cases, built to add new ones fast. Its shared components made design work 30% faster. It supports 900+ Figma files, and the team was starting to prototype with AI on top of it.

The story

Smartcat had 11 standalone use cases, each with its own interface, across a three-sided marketplace of 500,000 freelance linguists, built for Fortune 500 companies. The experience sat on rigid legacy architecture.

We worked one case at a time, each with a before and after.

Activation rose from 7% to 85% and task completion from 55% to 98%. We launched self-subscription, and its conversion went from 0% to 5%.

2.2Special
stage

Smartcat · Boston · 2021–2025

Team, principles and philosophy

How I built and ran the design team.

Status

Finished

The bottleneck. One design team spread across 11 use cases that were built in silos.

Control times · the big numbers

How I lead · six principles

EmpowermentFind the right people, give them meaningful challenges and let them cook. People who find their own solutions become a high-performing team.
CultureUser-centered thinking through open dialogue, regular feedback and data-informed decisions, in line with company goals.
TeamPersonal growth plans that stretch each designer’s skills and move their career forward.
CraftThe highest standards, with mentorship. Attention to detail and quality execution are non-negotiable.
AlignmentDesign as a partner in decisions, with strong ties to product, engineering and the business.
ImpactDesign decisions tied to business metrics and user needs, so design counts as a strategic function.

The cooking process

Beauty and function go together. A beautiful interface is easier to use, and care for the details people see shows care for the ones they never see. We reach for the ideal first, then plan practical steps. Reach for the stars, land on the moon.

Dual citizenship

Every designer belongs to their cross-functional product team, working with engineers and product managers every day, and to the design community, where they refine their craft.

UX rockets

Our team hub in Notion. Daily focus, philosophy, process, strategy, the design system, UX, sessions, community, knowledge, Rocketman’s, retrospectives and product.

The story

I built the design team at Smartcat and ran it through both UX transformations. These are the principles and habits we ran it on.

2.3Special
stage

Smartcat · Boston · 2021–2025

AI agents do the work, people check it

In 2024 Smartcat turned to AI agents, and I redesigned the product for it in three phases.

Status

Finished

The bottleneck. AI threatened Smartcat’s core business, translation, and the product worked like classic SaaS. Everything ran through projects, even a single file.

Control times · the big numbers

89%Of client companies adopted the agents, 1,200 in all, half of the Fortune 500 among them

The story

First, I upgraded our project templates into agents, and a chat became a way in. Then agents that bring in other agents. Last, agents you give a goal, like a project manager that chases freelance linguists until every asset is done.

3Rally

New York · 2025–now

Starbridge

I’m head of design at Starbridge, an AI platform that helps companies win government and education contracts. Alongside leading design, I came back to hands-on work as an individual contributor and went all in on building a software factory with AI.

Status

On stage now

$1M $20MStarbridge’s ARR while I’ve led design

3.1Leg 1
Design

Starbridge · New York · 2025–now · Leg 1

Core product redesign and Starbridge’s first design system

Rebuilt the core of a product built by engineers: first the feed, then how a Bridge is made.

Status

Finished

The bottleneck. Many journeys were broken, every engineer had changed the shared components in their own way, and ordinary users couldn’t grasp the product.

Control times · the big numbers

~1 monthCoding the new feed, live in January 2026
2Designers hired once the feed shipped
2% 50%Users who set up their own searches, once Bridge creation was redesigned

The story

Engineers built the product while the company looked for market fit. The data model was heavy, and every engineer had changed the shared components in their own way.

I questioned the basics before designing anything: an object model and a flow model first, screens after. My first project was the feed, where every buying signal a Bridge finds lands: builders and viewers got their own modes, one feed replaced two sharing concepts, and it went live in about a month. The second was how a Bridge is made: plain words in, criteria and scores you can read out, the first feature I designed in the prototype environment.

Along the way I built Starbridge’s first design system, and the product started to look like one product. Then I hired two designers, the best I have managed.

3.2Leg 1
Design

Starbridge · New York · 2025–now · Leg 1

Prototype environment

Moved the design system into code and built a prototype environment on it. The design team left Figma.

Status

On stage now

The bottleneck. Frontend shipped something different from the design, every time.

Control times · the big numbers

3–5xFaster design on the first feature. 9–10 weeks of work done in 3.
5–10xMore complete specs in Linear, written from the prototype
8 monthsDesigning without Figma, and counting

The story

With Claude Code I moved the design system into code, so design owns the components, and built a prototype environment on the same system. The first feature took 3 weeks of design work instead of 9 or 10, and real prototypes changed the discussion around it.

Specs in Linear are written from the prototype now, 5 to 10 times more complete than by hand. The whole design team moved over in 3 to 5 months, and product managers prototype their ideas there too.

3.3Leg 2
Customer intelligence

Starbridge · New York · 2025–now · Leg 2

Customer intelligence pipelines

Pipelines that read every customer call and trial email overnight, check each signal twice, and brief each team in Slack by morning.

Status

On stage now

The bottleneck. Priorities came from the loudest customer or the strongest opinion in the room, and big trials could go quiet without anyone noticing in time.

Control times · the big numbers

20,527Signals kept, from 776 customer accounts
1 in 4Candidates the quality check agent throws out
3 lanesExisting customers, onboarding and sales trials

The story

I wanted the whole customer base heard. My team and I had proved the idea by hand at Smartcat, on 400 calls from one quarter. The tools I tried didn’t hold up, so I built my own there.

At Starbridge I built it again, starting with customer success calls. It finds praise and ROI for the team and for marketing, and gathers problems into a backlog that can prove or disprove what we are told. Every night, two AI passes read each new conversation: one finds candidate signals, the other throws out about one in four. Cards and a morning brief land in Slack, a web app holds the evidence, and anyone can ask Claude.

Once that pipeline worked, other teams asked for their own. New customers were sometimes oversold or confused, often about AI credits. I added lanes for onboarding and for sales trials, reading calls and trial emails.

Now the team that owns onboarding fixes the bottlenecks its signals show, and sales leadership coaches reps from what happens in trials. Customer success and sales use the signals for their accounts, the wider company reaches them mostly through Claude Cowork, and the backlog feeds the roadmap with real data.

3.5Leg 3
Marketing

Starbridge · New York · 2025–now · Leg 3

Marketing website, run from Slack

Rebuilt the marketing website with Claude Code in five days, then handed it to marketing through Slack.

Status

On stage now

The bottleneck. Every change was a ticket and took weeks, so nobody wanted to touch the design.

Control times · the big numbers

~210 pagesRebuilt in five days
6Marketers onboarded
Weeks dozens a dayHow fast website changes ship

The story

About 210 pages lived on Webflow, and an outside agency built every new one.

I rebuilt the whole site in five days with Claude Code, on templates and the same design system approach. Then I set up a Slack channel with Claude where marketers ask for changes in plain words.

Six marketers onboarded. Changes went from weeks to dozens a day, and pages are now made for each ad cohort.

3.6Leg 3
Marketing

Starbridge · New York · 2025–now · Leg 3

Product graphics

Turned the prototype into the source of product graphics that stay as current as the product.

Status

On stage now

The bottleneck. Screenshots went out of date the day they shipped, and nobody owned them.

Control times · the big numbers

54Product graphics in four weeks
Still or animatedA still of one screen, or a walkthrough of a whole flow
HTMLFlows from Storybook tests, sharp at any size

The story

Marketing needs product images and flows to tell the story.

The prototype is a full copy of the product, so I made it the source. Flow tests in Storybook became HTML graphics. Anyone can ask for one in Slack, and agents watch the product and update graphics everywhere.

It took a few skills and a few tools stitched together, because the rest was already built.

3.7Leg 3
Marketing

Starbridge · New York · 2025–now · Leg 3

Asset library and the marketing design system

Built an internal asset library and grew the website design system into one for the whole marketing organization.

Status

On stage now

The bottleneck. Everyone made their own materials, and the brand drifted.

Control times · the big numbers

1,136Assets in the library, as of November 1, 2026
9Team members making materials with it
1 systemFor the website, slides and social posts

The story

Sales, business development reps, ads and outbound all make their own versions of marketing’s templates. Once everyone had AI, those versions drifted further from the brand.

I built an asset library where product graphics and Slack requests land, and the marketing team approves what goes out. Then I grew the website design system into one for all of marketing, with slides and social posts, connected to the library, Claude Cowork and Claude Code.

What the company makes now comes out on brand, with product graphics as current as the product.